Project Overview
- Role
- Solo build
- Timeline
- July 2026 - August 2026
- Stack
- Status
- Shipped
- Link
- View on GitHub ↗
What I worked on
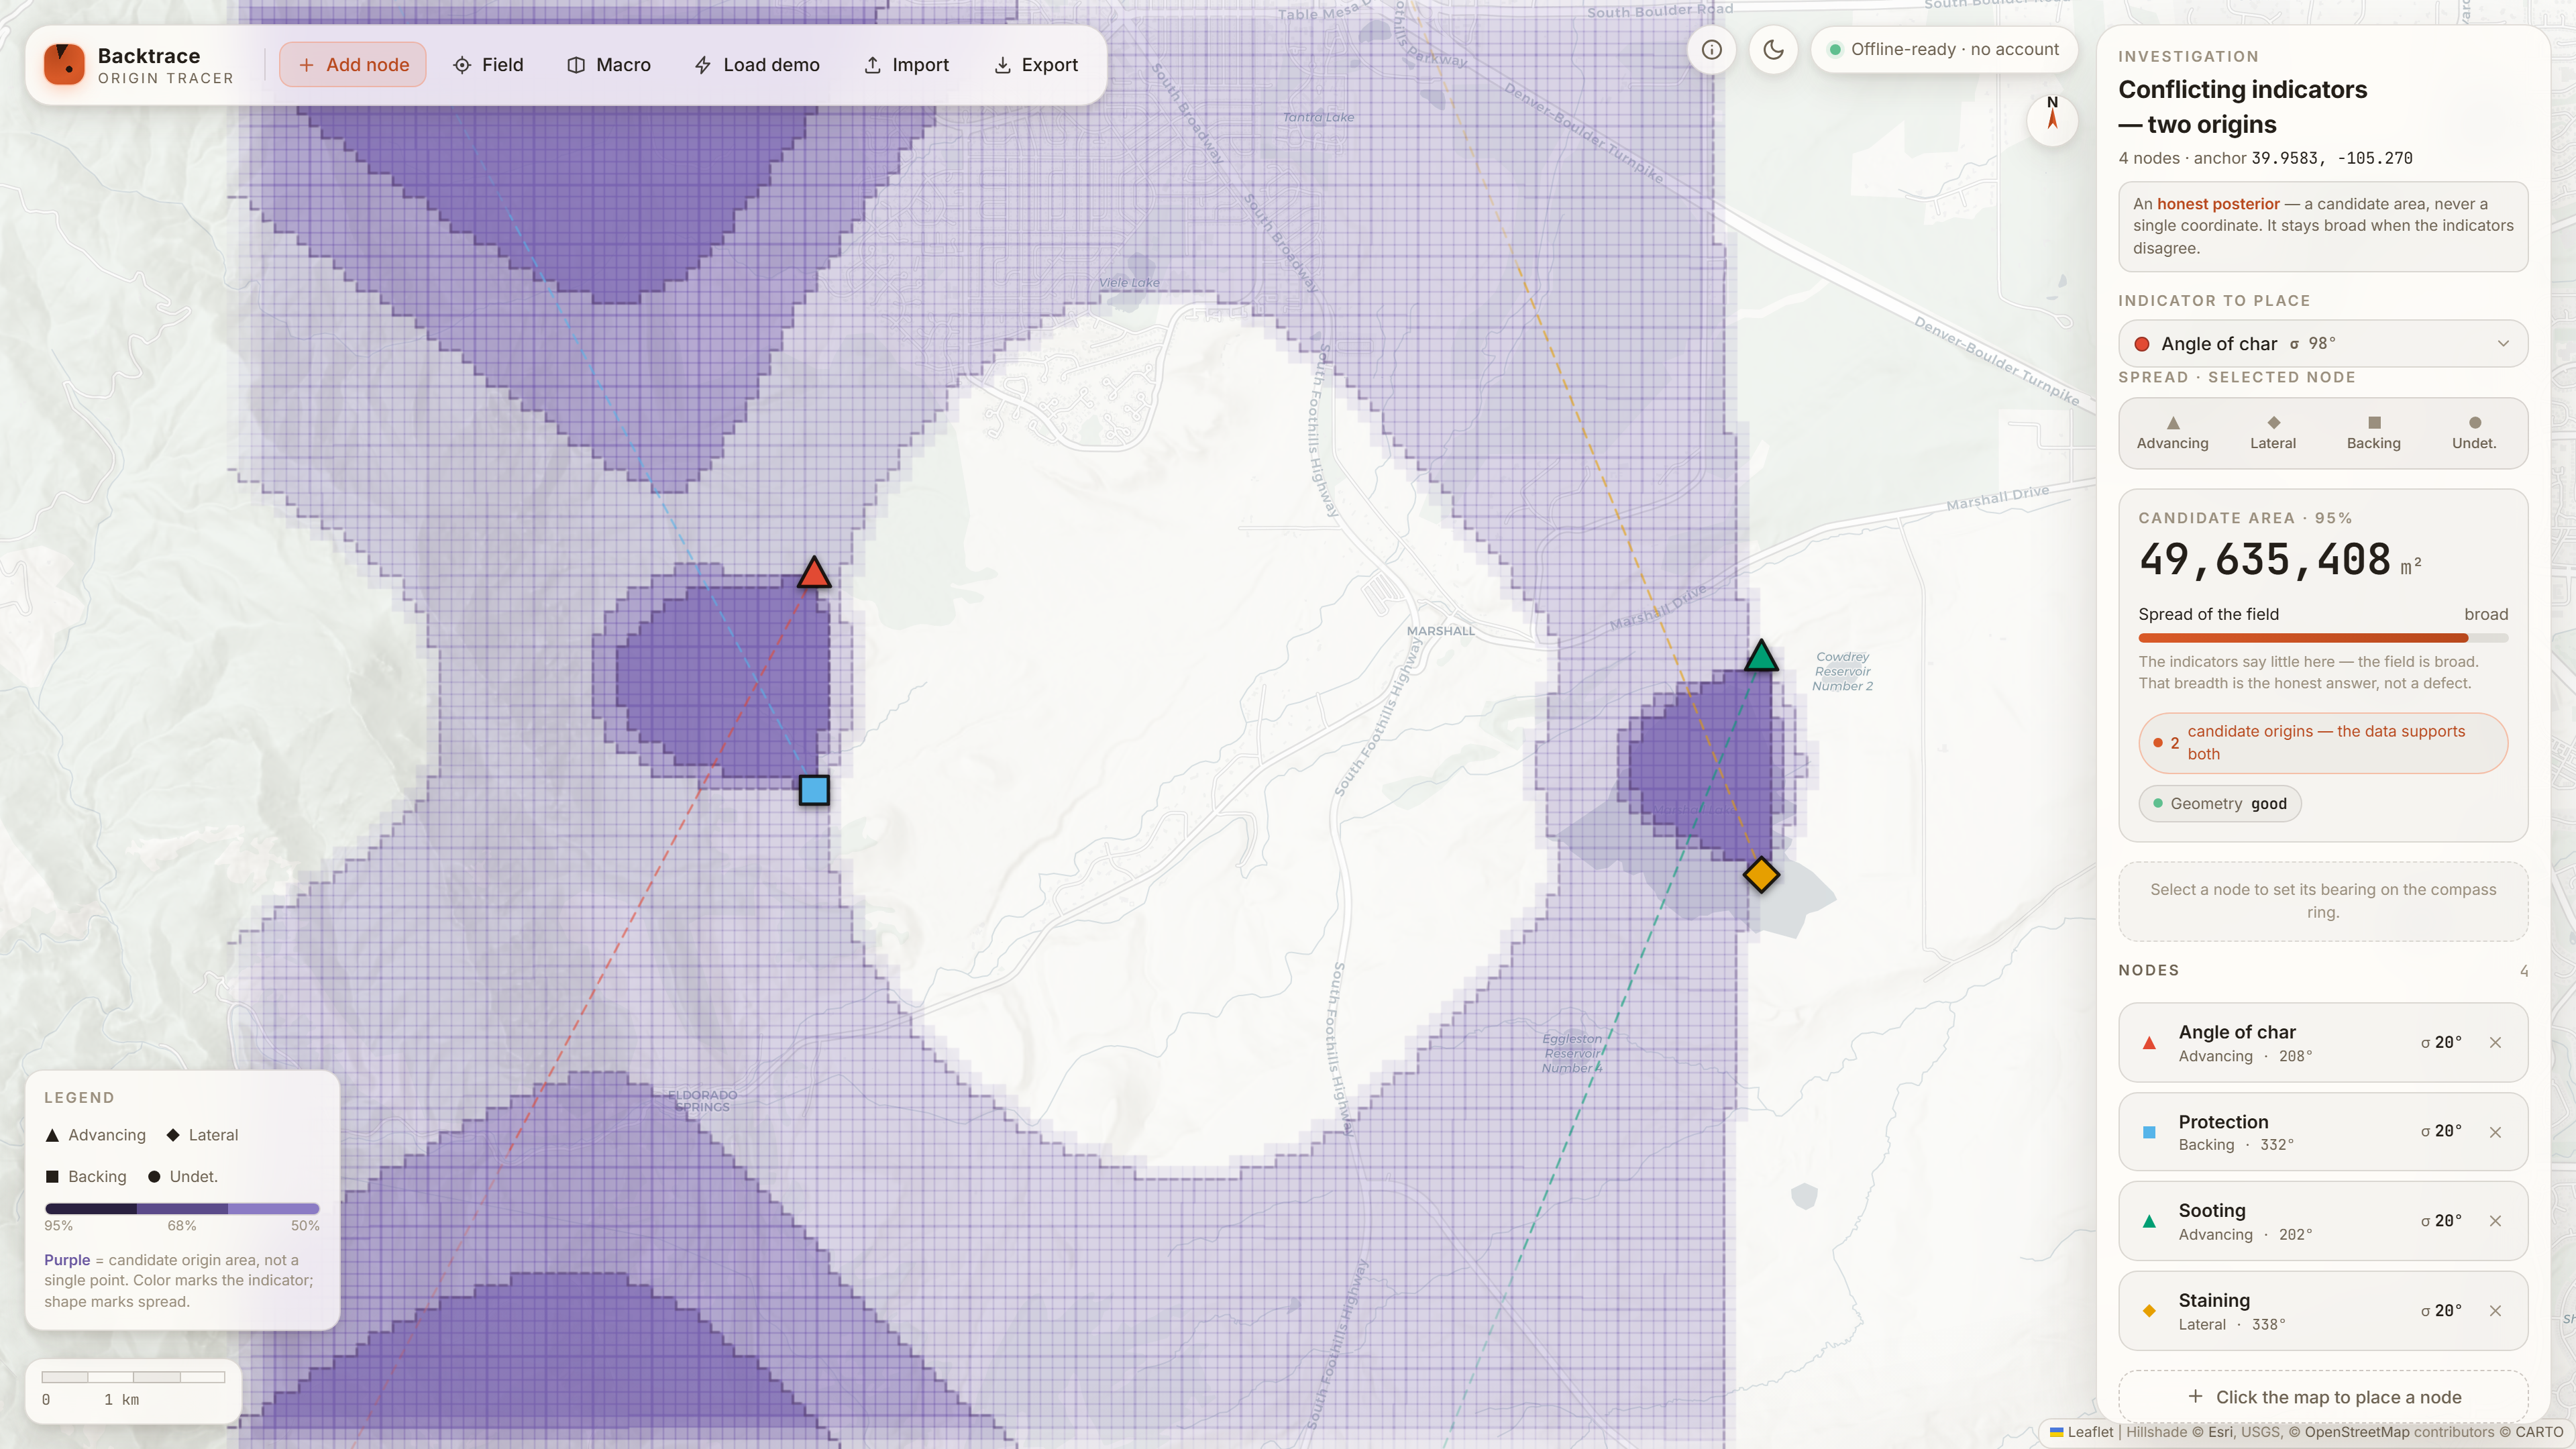
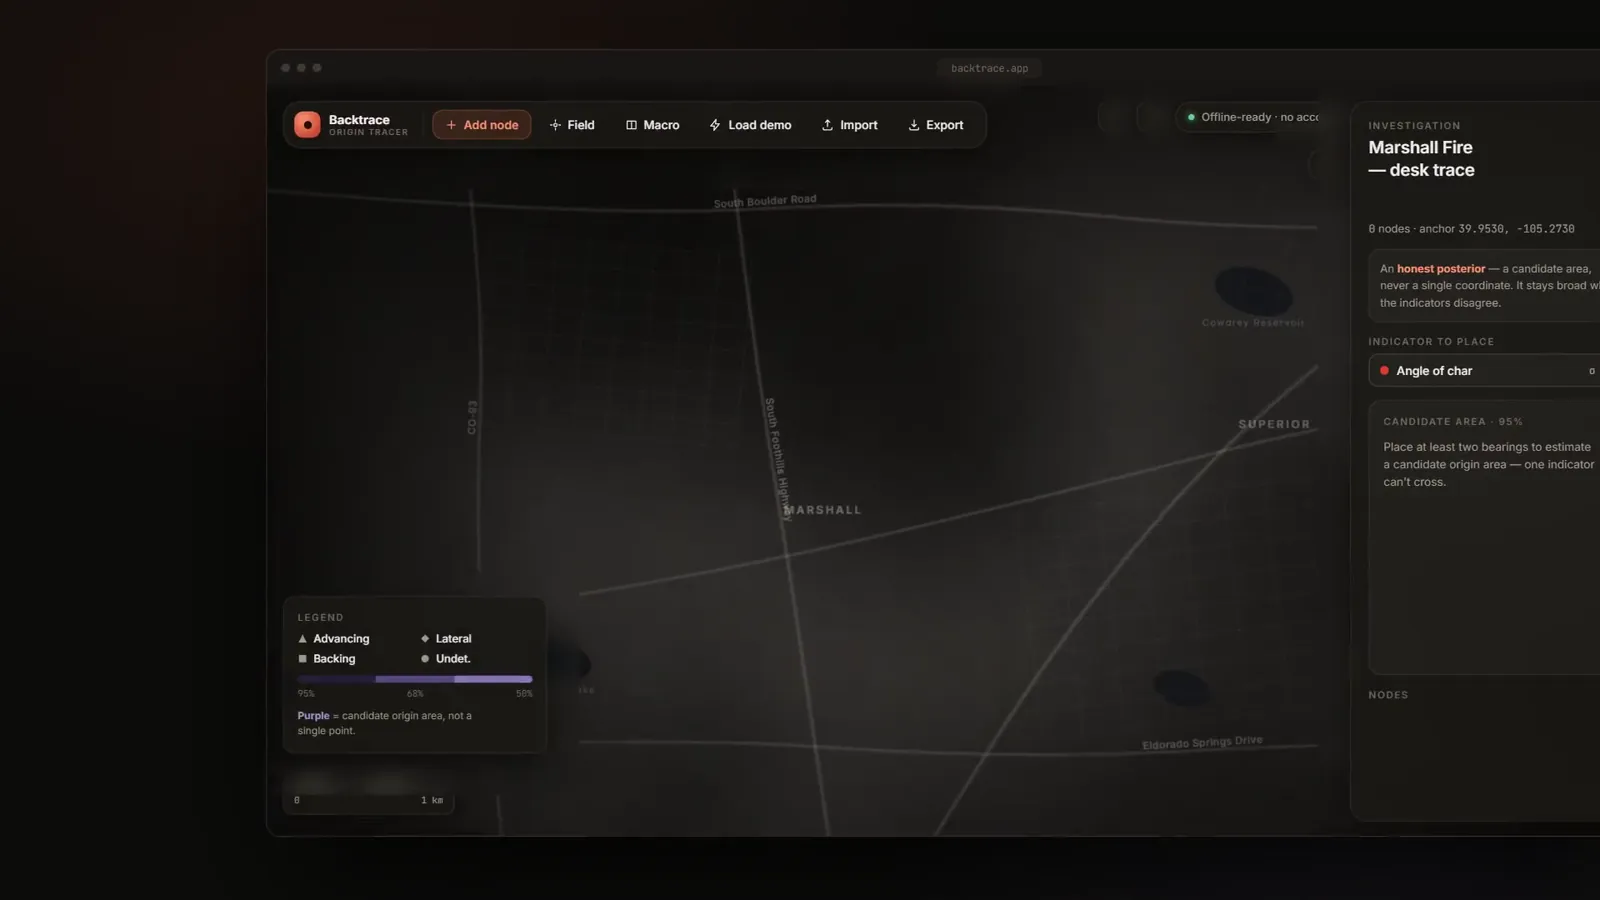
A field instrument for reasoning about where a wildland fire started. You walk the burn with a map, flag physical fire-pattern indicators, and record the direction each one points. Backtrace fuses those bearings — each carrying its own angular uncertainty — into a probability field for the origin, rendered as a heatmap with credible regions rather than a single dot, and generates a PDF report from the result.
The Challenge
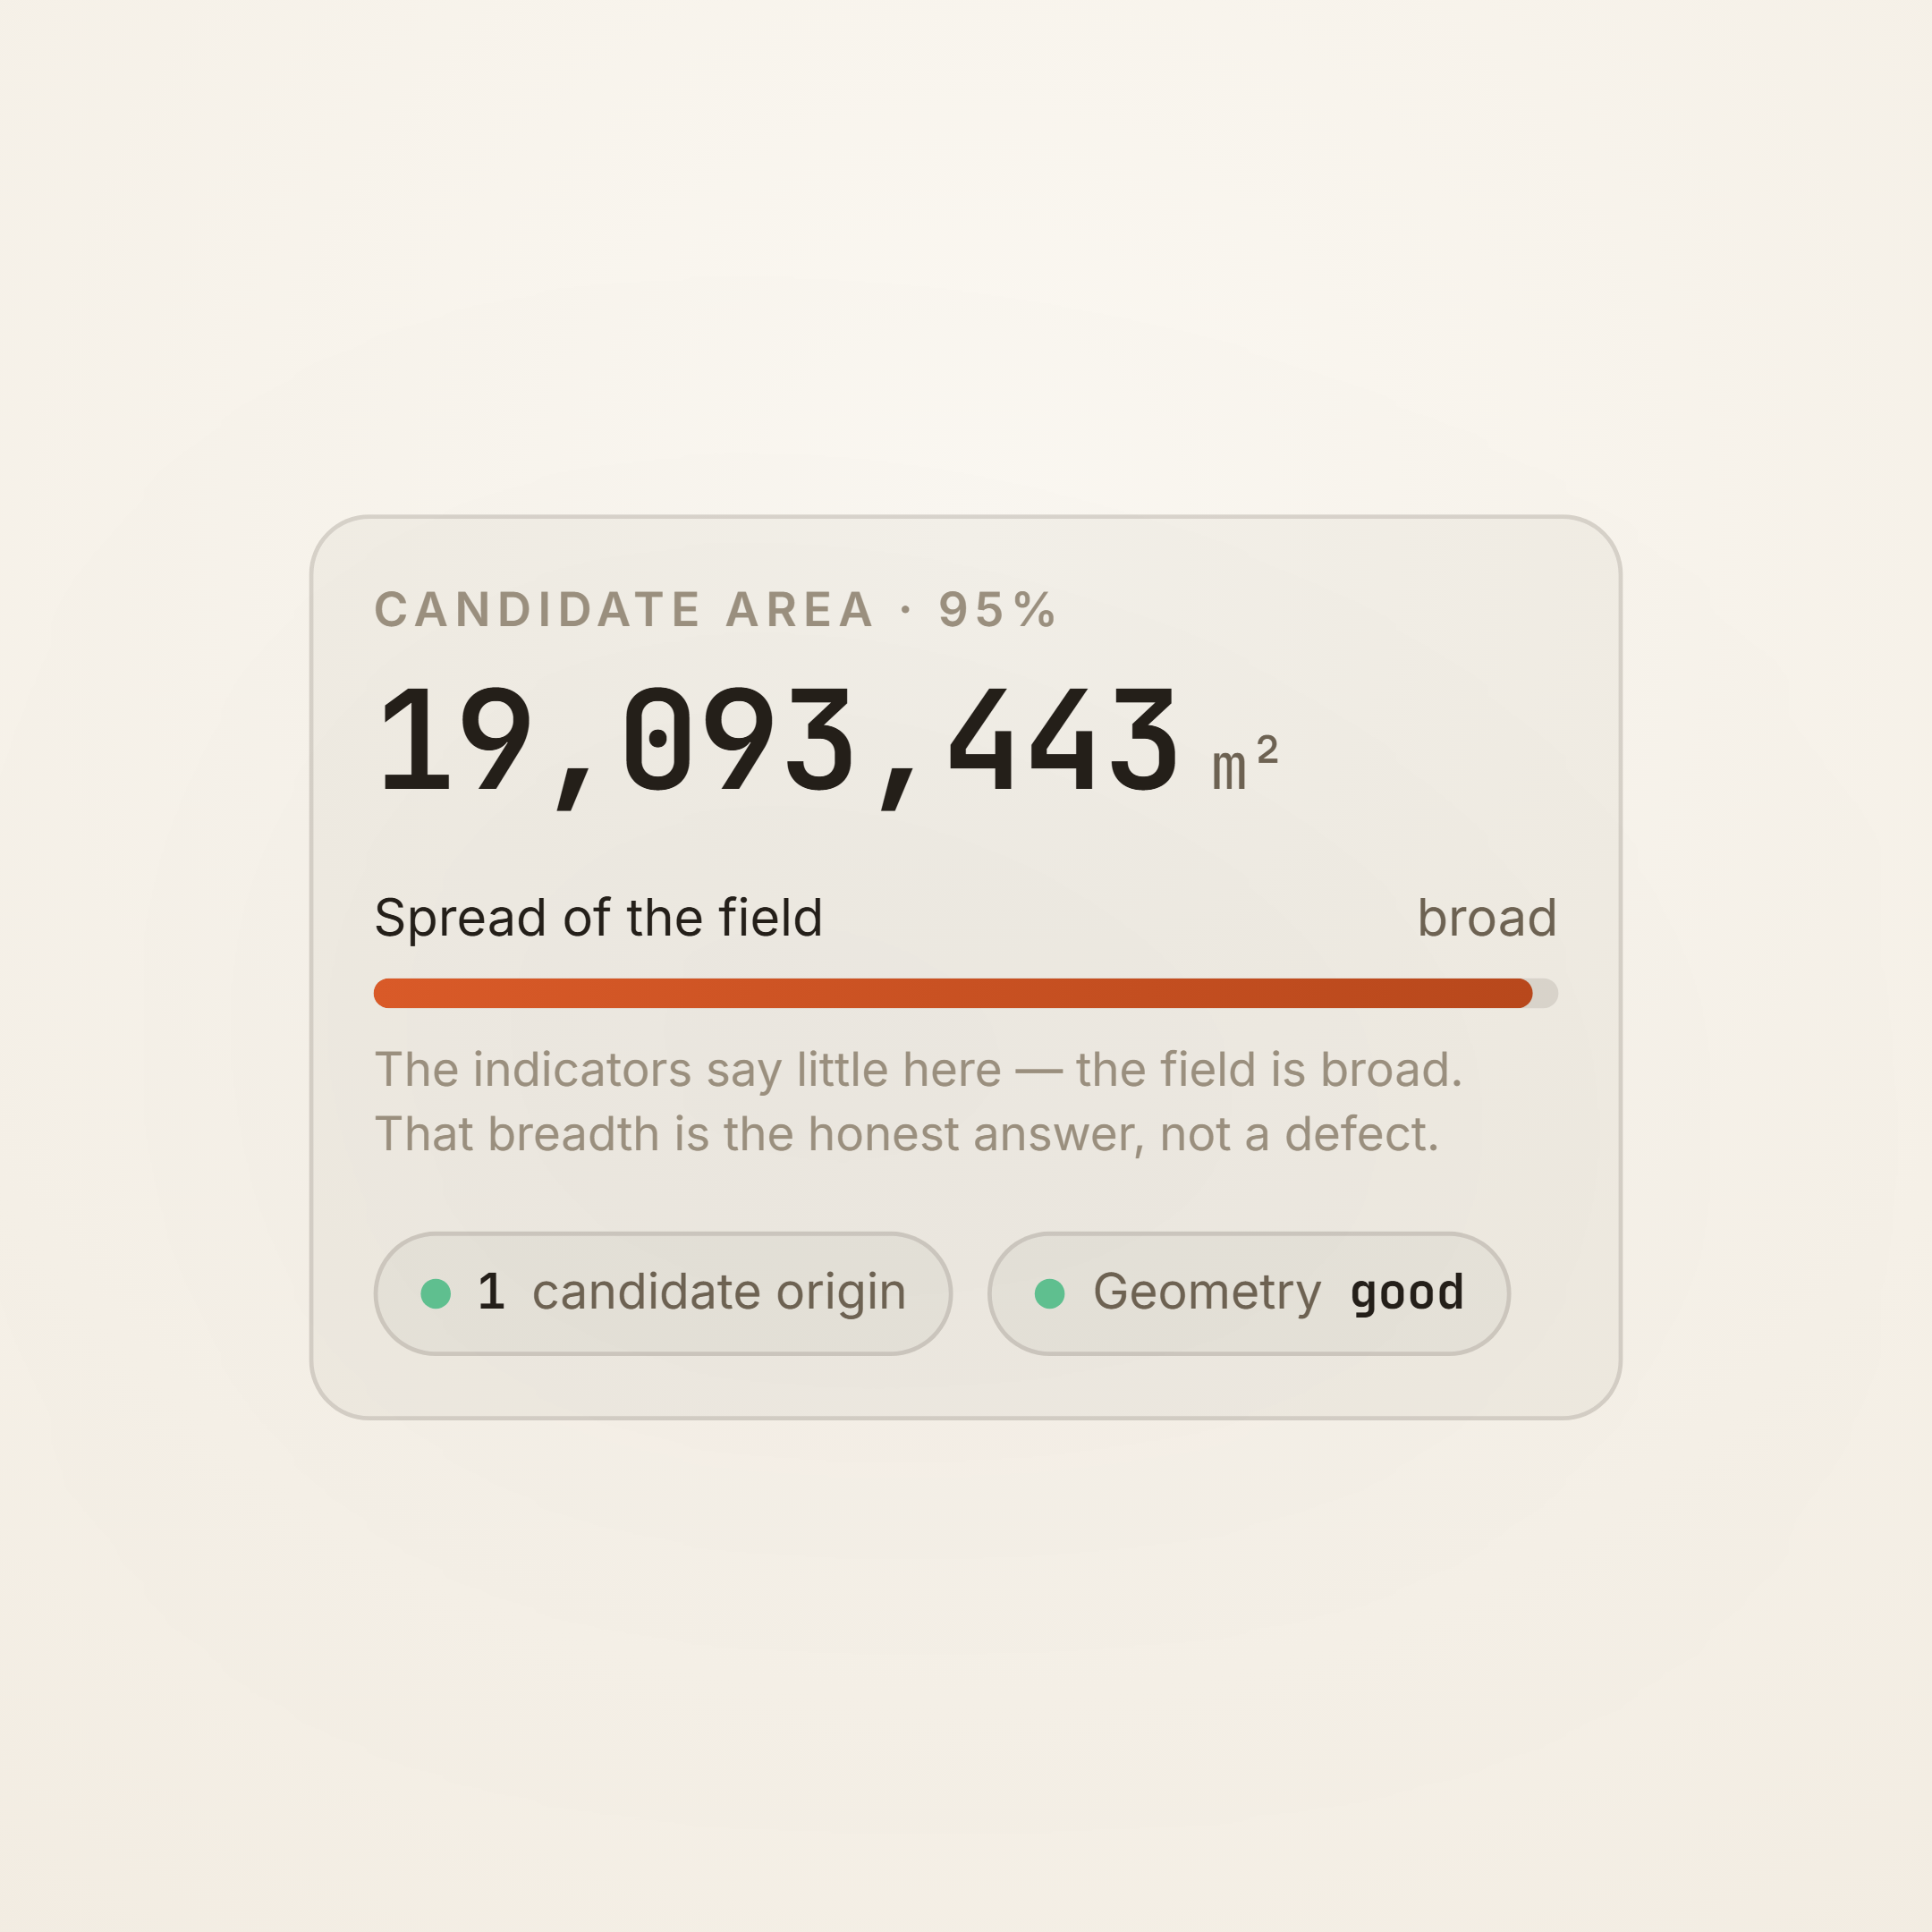
Staying honest about uncertainty. The instinct is to draw one confident point where the bearings cross, but real bearings are noisy — so the hard part was fusing them into a credible probability field with honest regions instead of a false-precision single point.
The process
Indicator taxonomy
Catalogued the physical fire-pattern indicators a walker flags in the field.
Map + bearing capture
The map-based walk-the-burn workflow for recording each indicator's direction.
Angular-uncertainty model
Gave every bearing its own angular uncertainty rather than a hard line.
Bearing fusion
Fused the noisy bearings into a single probability field for the origin.
Probability field / heatmap
Rendered credible regions as a heatmap — not a false-precision dot.
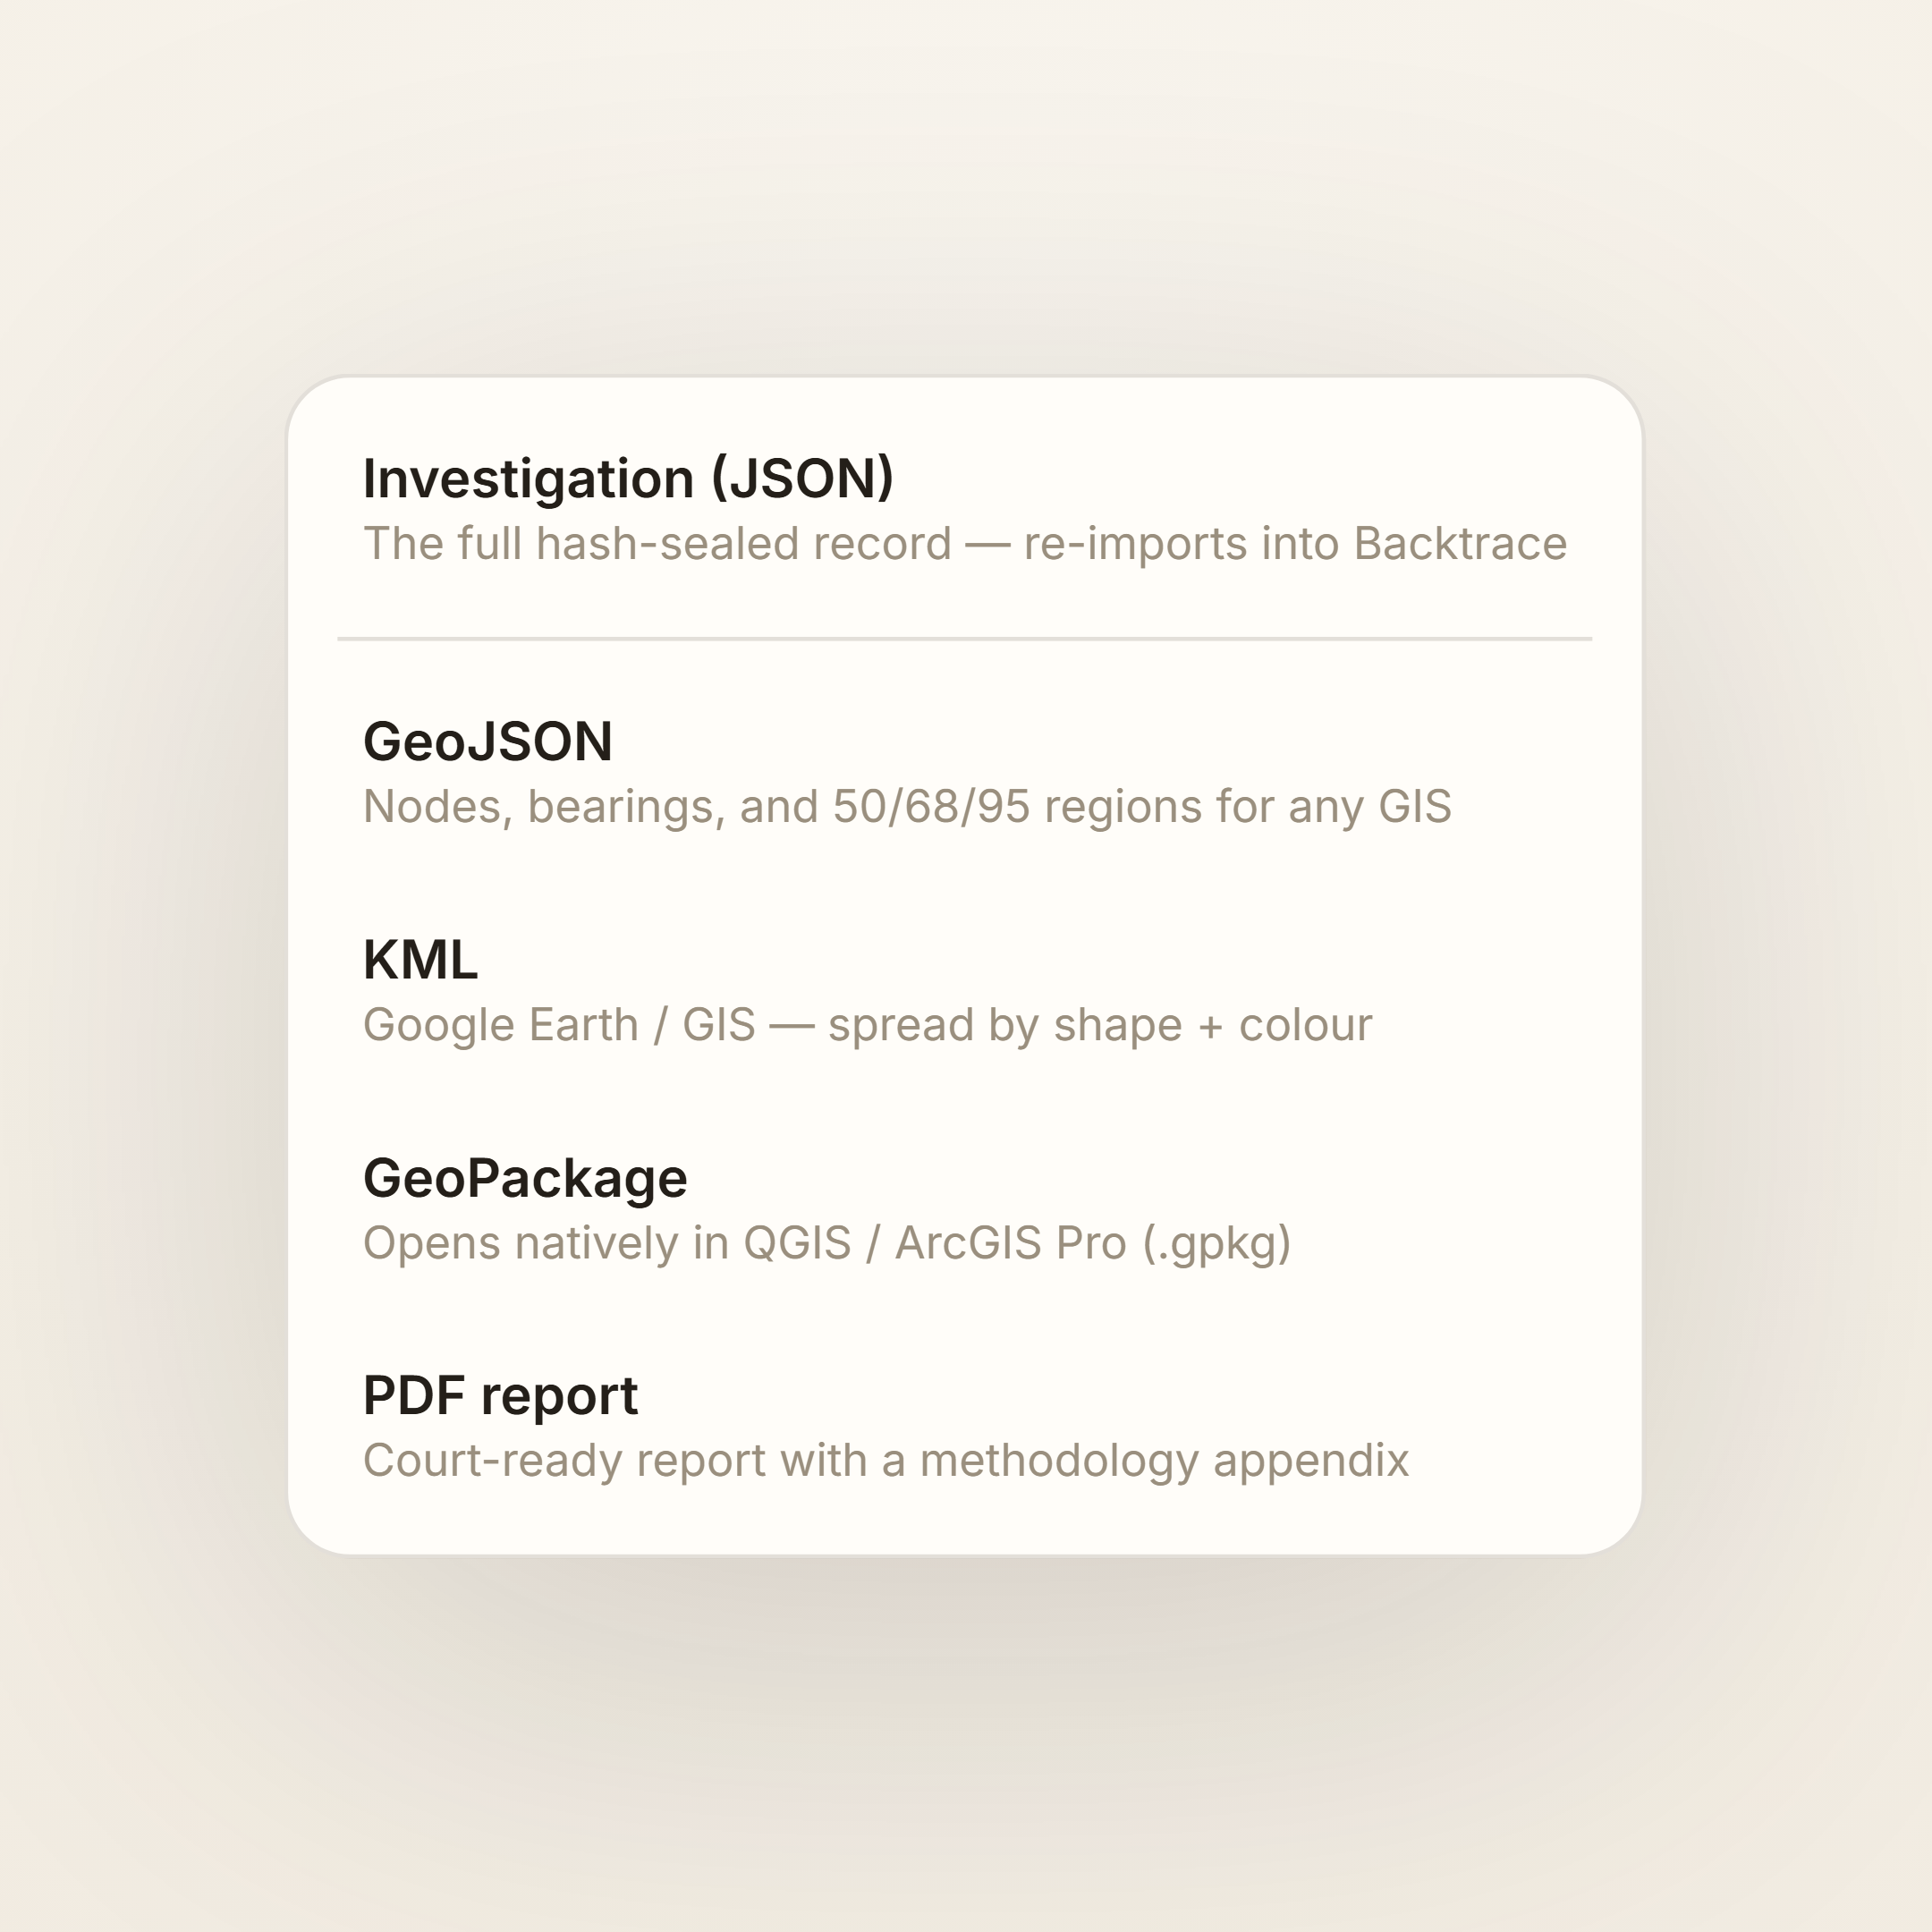
PDF report generation
Generated a shareable report from the fused result.
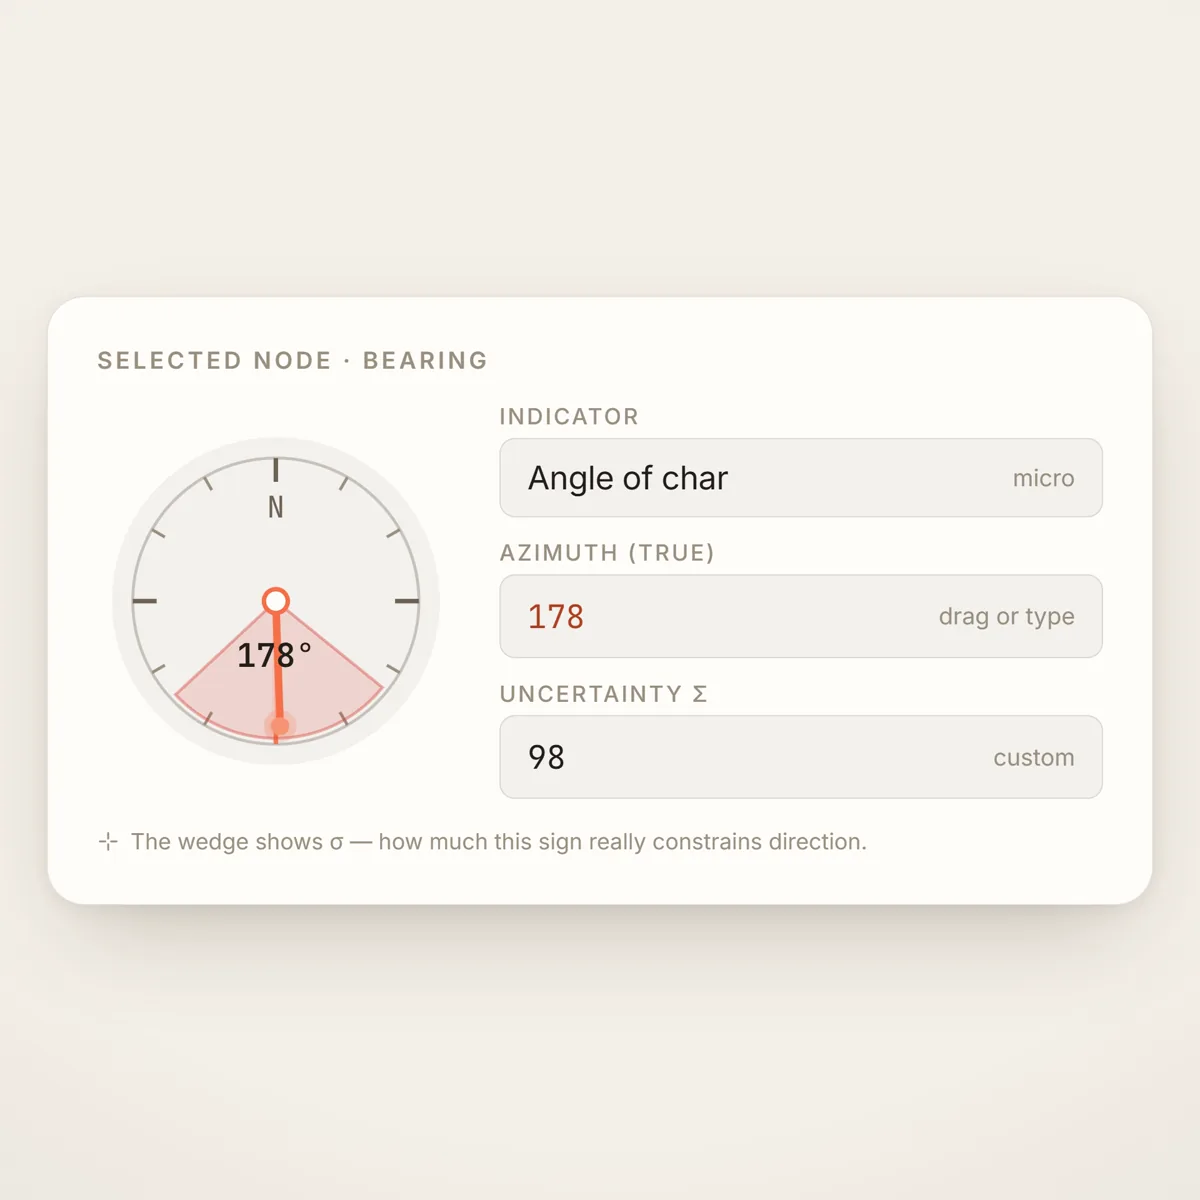
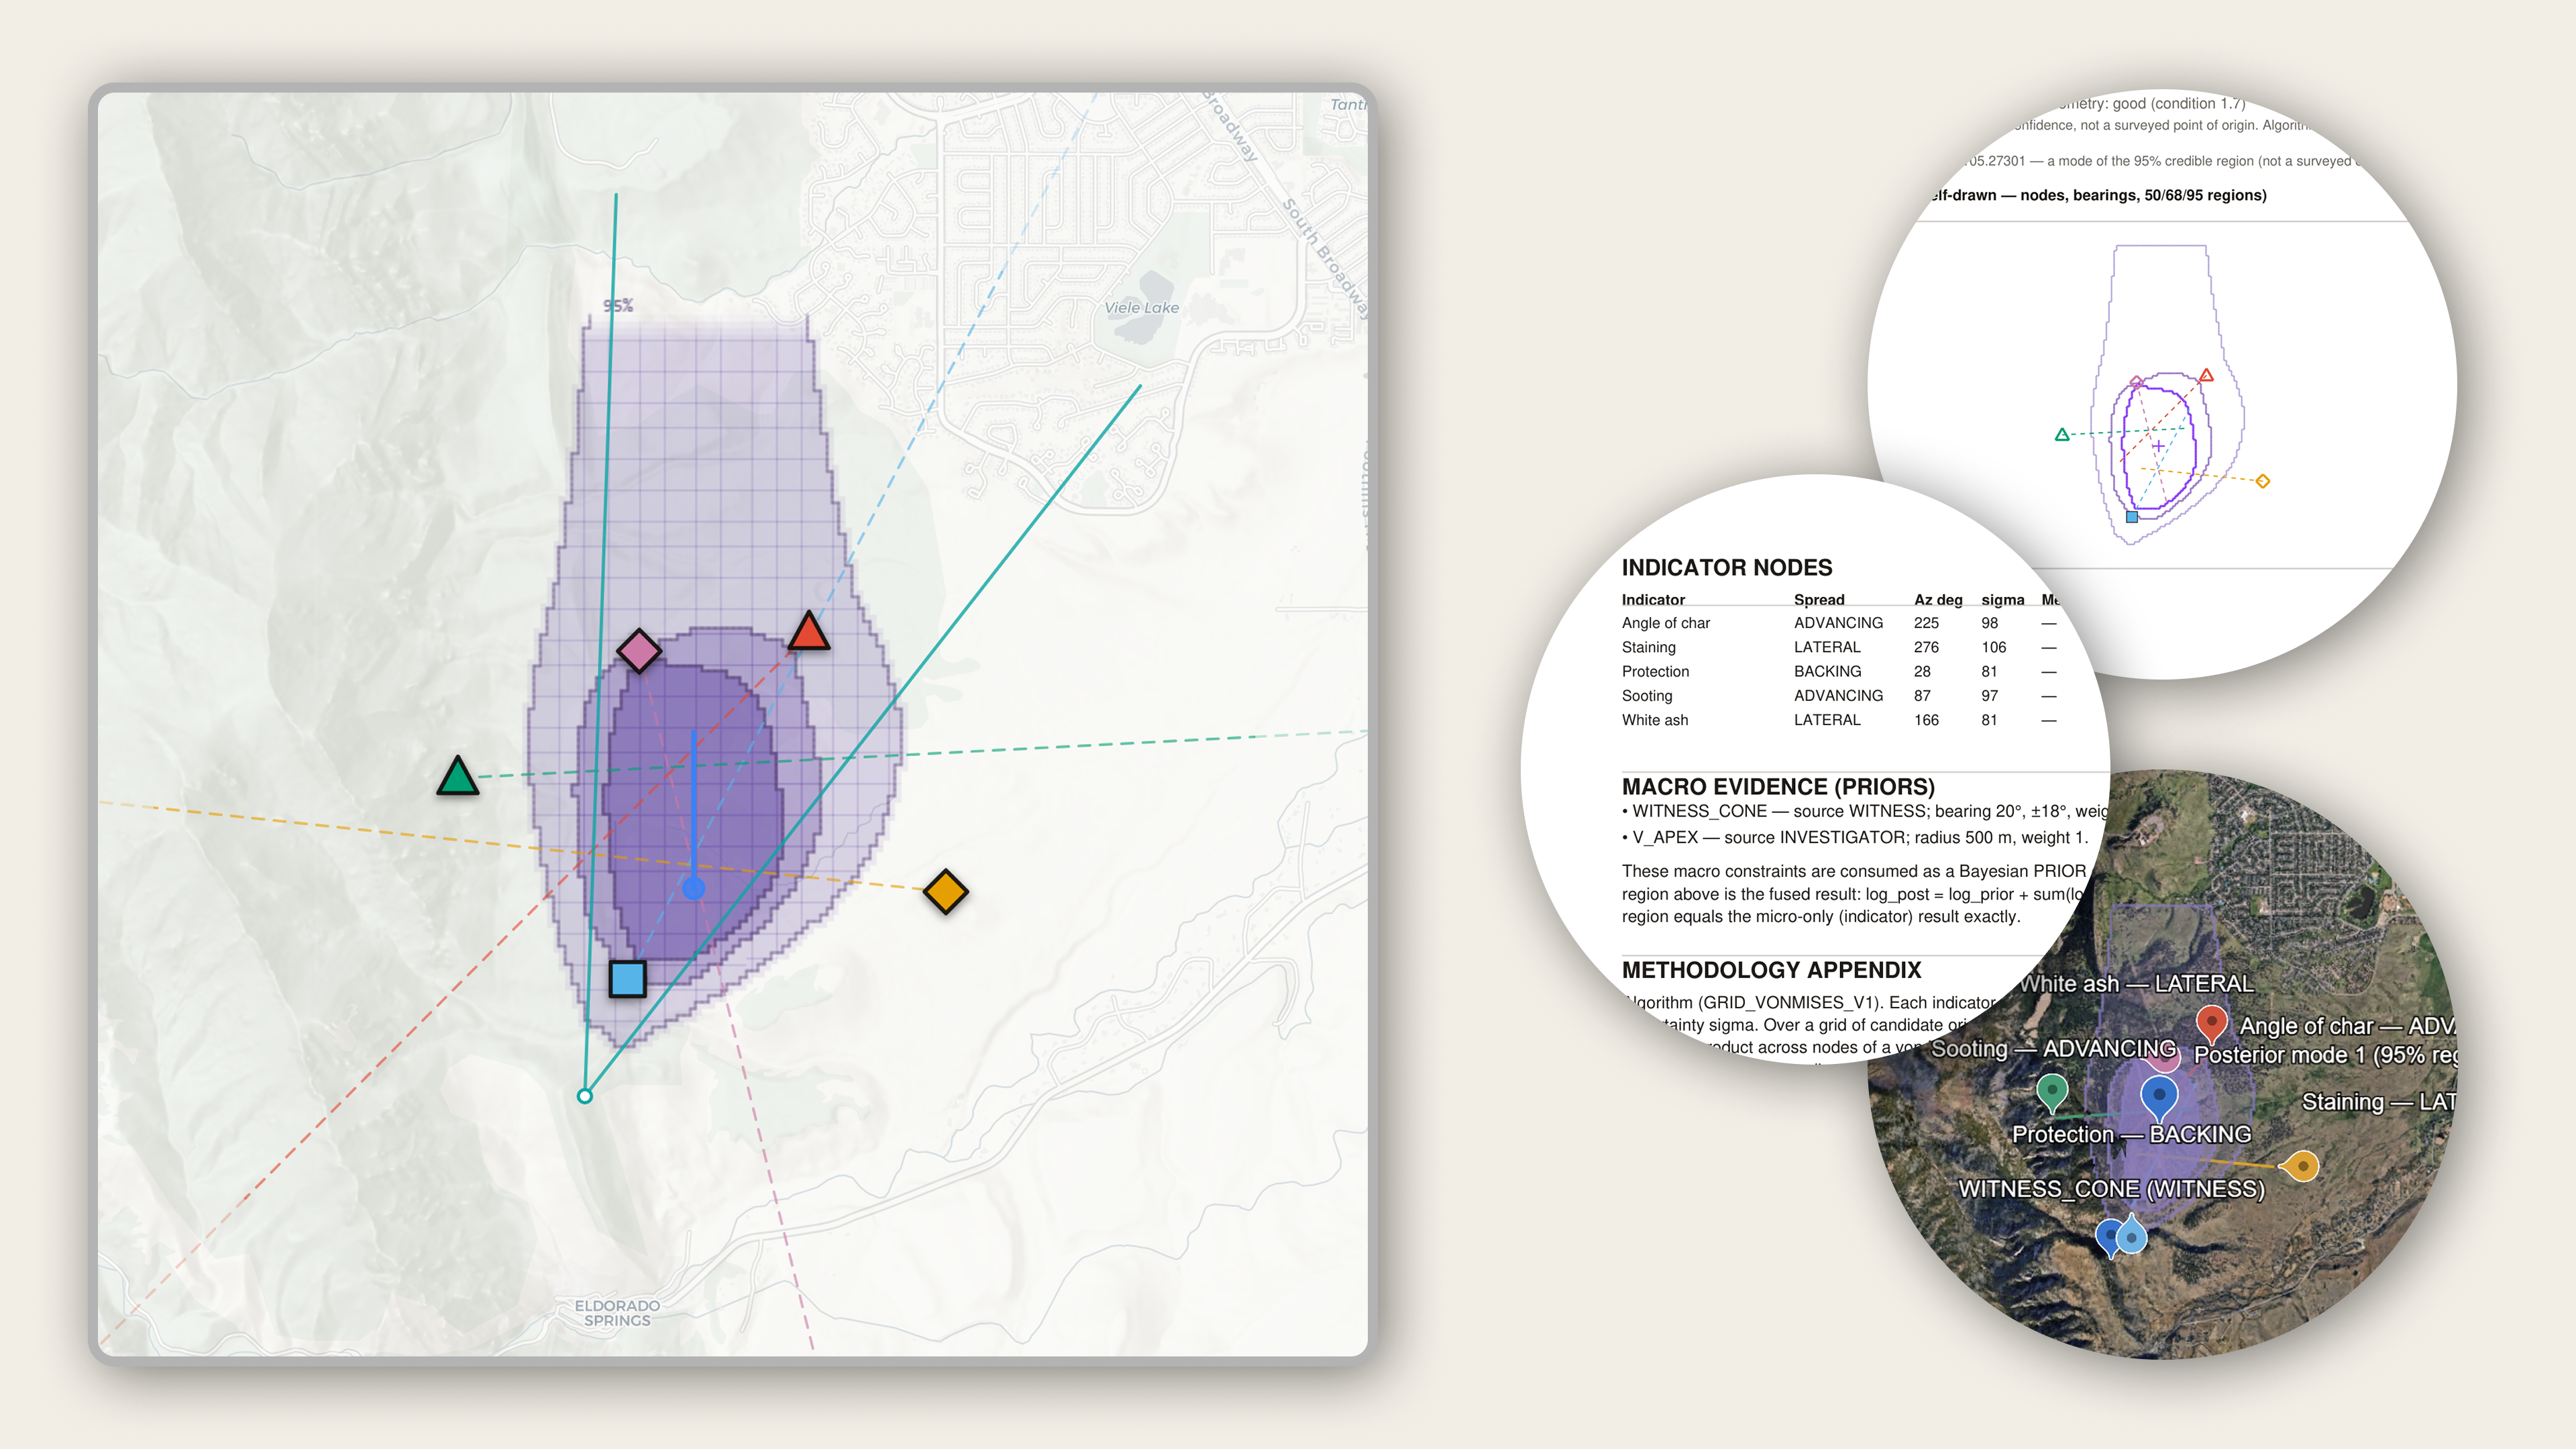
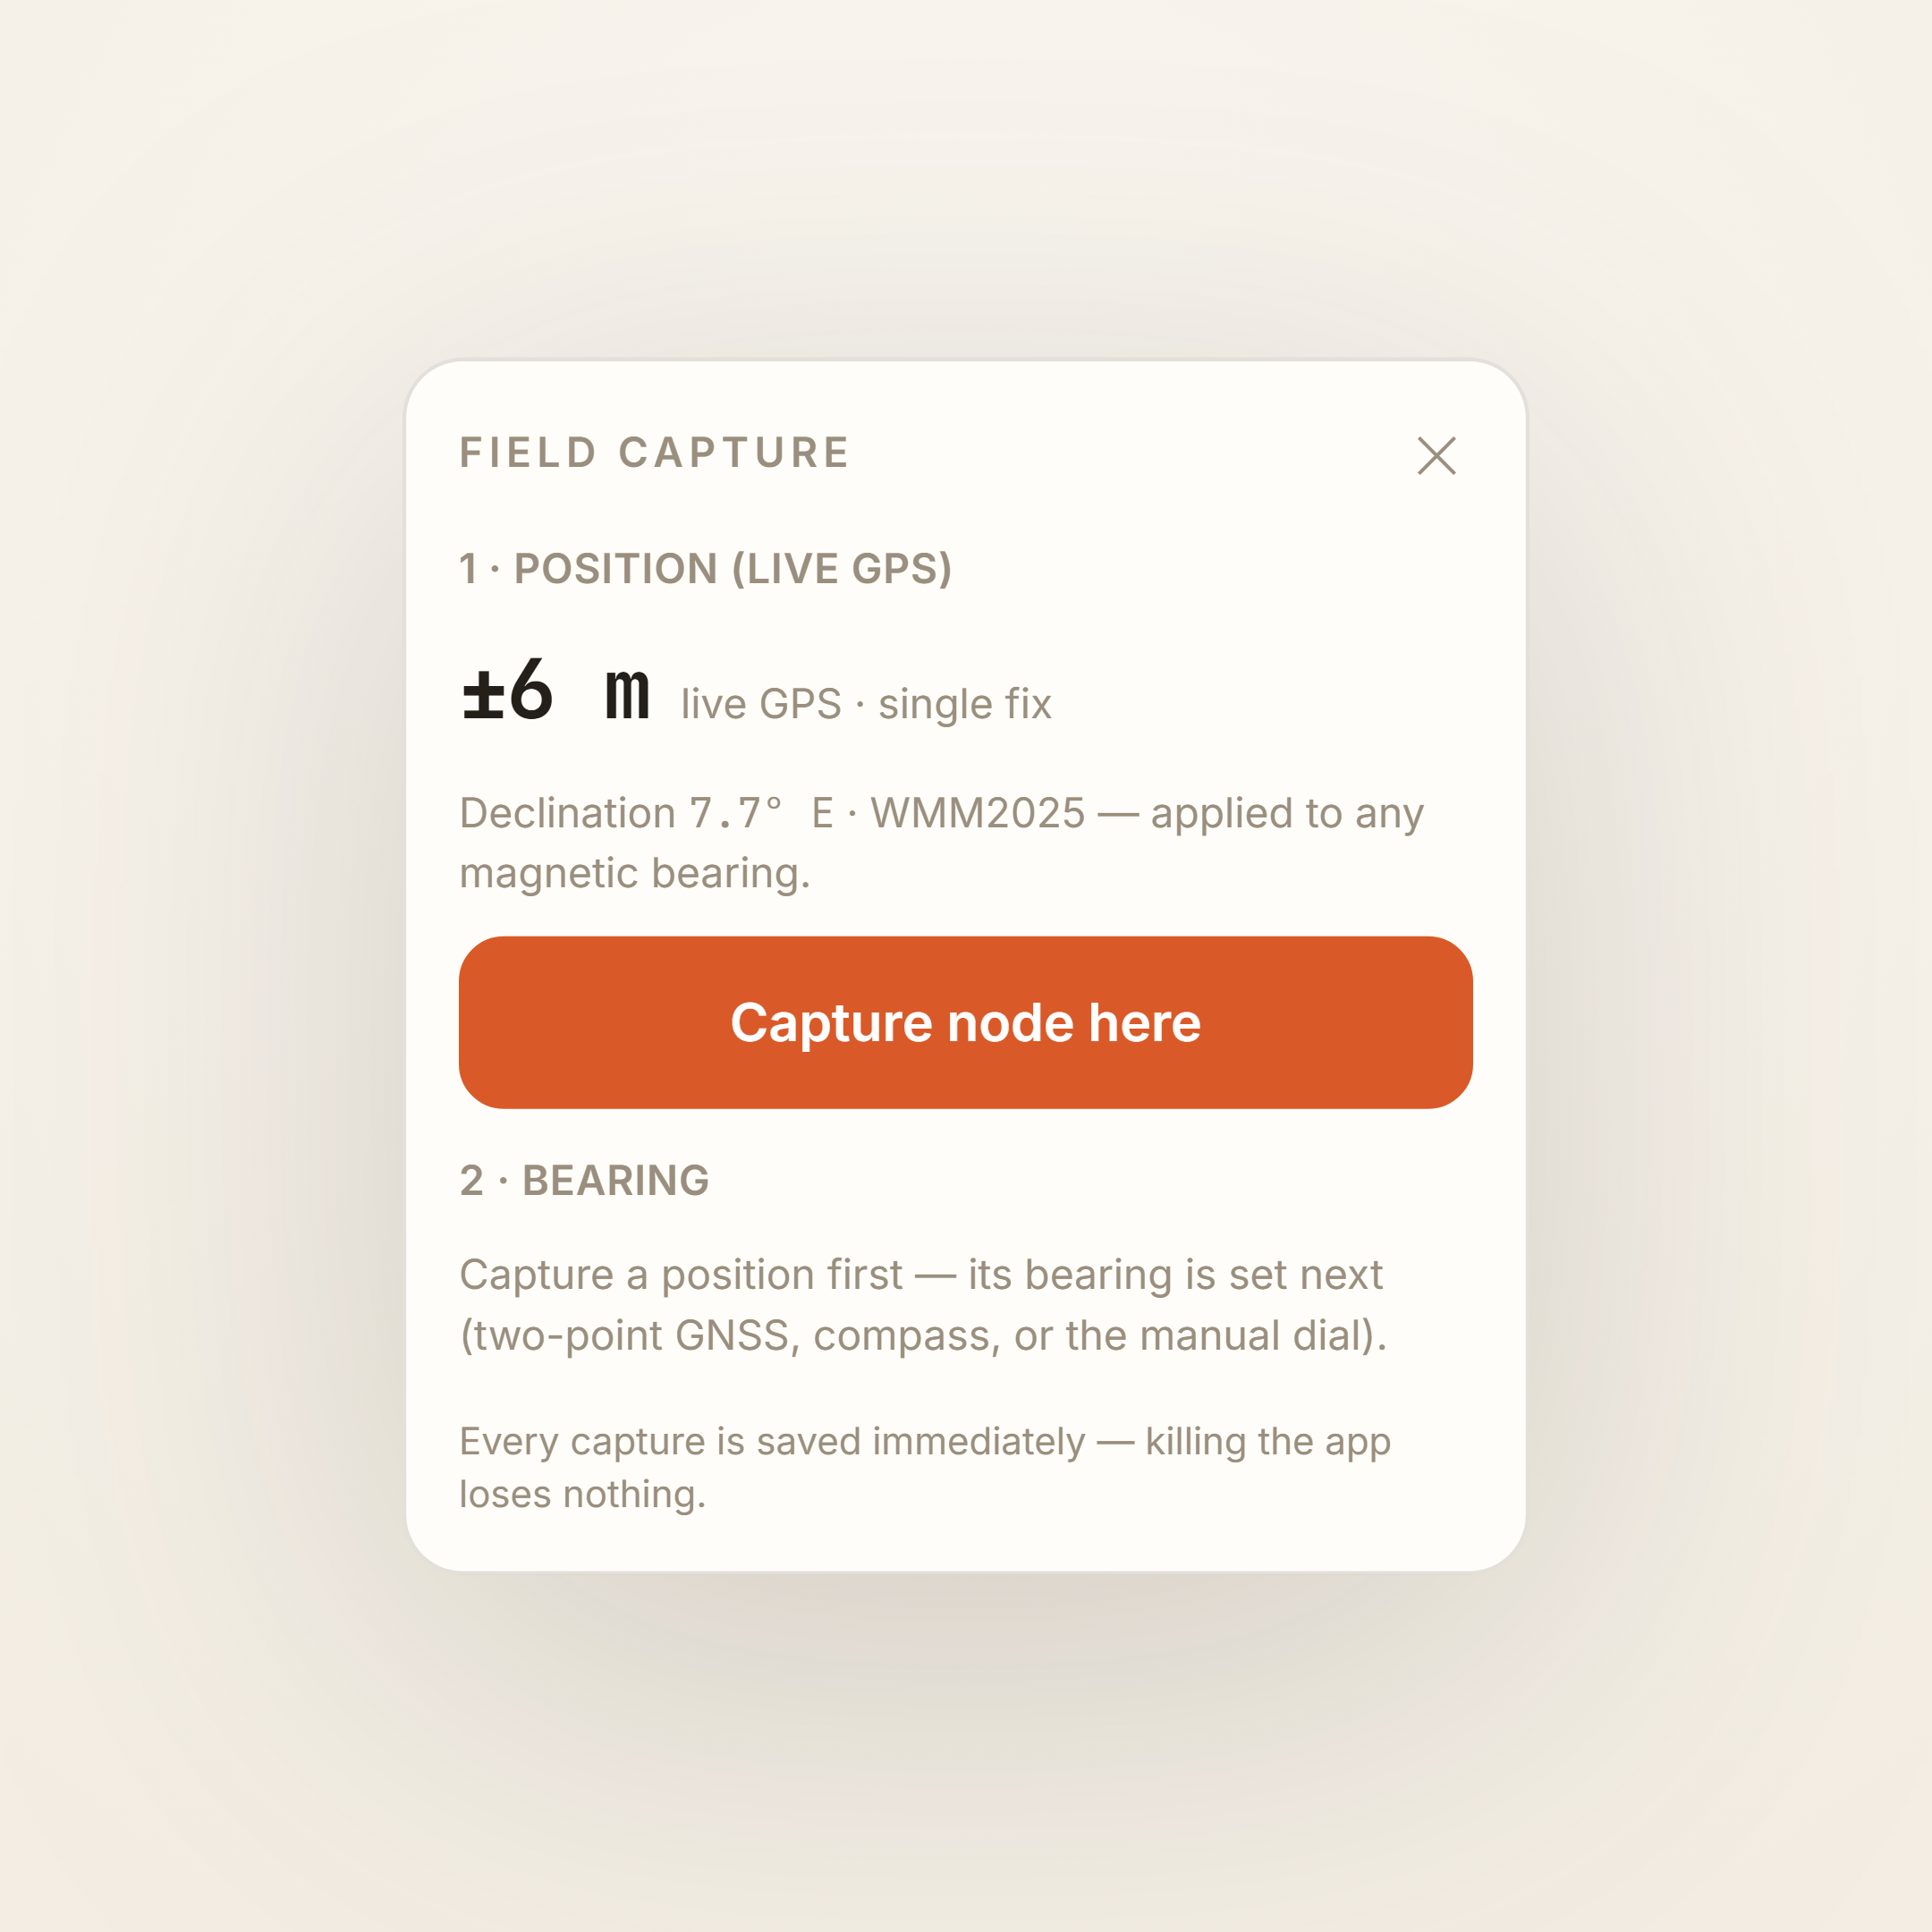
I built Backtrace because finding where a wildland fire started is a much harder question than it sounds, and the honest answer is usually that we're not entirely sure. The work is physical. You walk the burn with a map, you look for the marks the fire leaves behind as it moves, and for each one you record the direction it points back toward the origin. Every mark gives you a bearing, and the thing nobody tells you is that no single bearing can be trusted on its own.
I wanted something that admitted what it didn't know.
That was the part I kept coming back to. Most tools want to cross a few lines and drop one confident pin, which feels reassuring and is often wrong. I wanted something that admitted what it didn't know, so I leaned on a simple idea: treat every bearing not as a hard line but as a bell curve of belief around a direction, wider when the reading is shaky and tighter when it's clean. In plain terms, a point on the map scores well when it sits close to the direction a bearing points, and its score falls off the further it drifts:
P(origin) ∝ ∏ᵢ exp(−θᵢ² / 2σᵢ²)
You can read that left to right without knowing the notation. Each bearing gives a candidate point a score based on how far off its angle is, softened by how uncertain that reading was. You multiply the scores together rather than add them, because independent pieces of evidence should agree with each other to count, and one confident bearing pointing elsewhere can quietly veto a spot. Do that across the whole map and the numbers stop being lines and become a landscape: tall where the evidence piles up, flat where it doesn't.
That landscape is the answer Backtrace actually gives you. Instead of a single false pin, you get a heatmap with credible regions showing where the origin probably is and how sure the evidence lets you be. Getting that honesty right was the whole point, and easily the hardest part to build. From the fused field it generates a PDF report, so the reasoning travels with the conclusion and the person reading it can see how you got there rather than trusting a dot on a map.